CO2Science
Reference
Vinther, B.M., Jones, P.D., Briffa, K.R., Clausen, H.B., Andersen, K.K., Dahl-Jensen, D. and Johnsen, S.J. 2010. Climatic signals in multiple highly resolved stable isotope records from Greenland. Quaternary Science Reviews 29: 522-538.
Background
The authors introduce the report of their new study by writing that “during the past 10 years studies of seasonal ice core δ18O records from the Greenland ice sheet have indicated, that in order to gain a firm understanding of the relationships between Greenland δ18O and climatic conditions in the North Atlantic region, it is important to have not only annually resolved, but seasonally resolved ice core δ18O data.”
What was done
Working with 20 ice core records from 14 different sites, all of which stretched at least 200 years back in time, as well as near-surface air temperature data from 13 locations along the southern and western coasts of Greenland that covered approximately the same time interval (1784-2005), plus a similar temperature data set from northwest Iceland (said by the authors to be employed “in order to have some data indicative of climate east of the Greenland ice sheet"), Vinther et al. proceeded to demonstrate that winter δ18O was “the best proxy for Greenland temperatures.” Then, based on that determination and working with three longer ice core δ18O records (DYE-3, Crete and GRIP), they developed a temperature history that extended more than 1400 years back in time.
What was learned
In the words of the seven scientists, “temperatures during the warmest intervals of the Medieval Warm Period,” which they defined as occurring “some 900 to 1300 years ago, “were as warm as or slightly warmer than present day Greenland temperatures [italics added].”
What it means
As for what this result implies, the researchers conditionally—and rather amusingly—state that further warming of present day Greenland climate “will result in temperature conditions that are warmer than anything seen in the past 1400 years.” But, of course, their work more directly and unconditionally implies that late 20th-century and early 21st-century weather has not yet been warm enough to confer “unprecedented” status upon Greenland air temperatures. What is more, Vinther et al. readily admit that the independent “GRIP borehole temperature inversion suggests that central Greenland temperatures are still somewhat below the high temperatures that existed during the Medieval Warm Period.” H/T Marc Morano and C3Headlines.
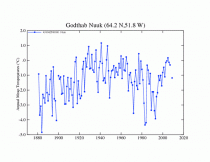
ICECAP NOTE In fact it was warmer in the 1930s/40s than today. Here below (enlarged here) is the NASA GISS plot of Godthab Nuuk.
Zheng et al. on the NIPCC Website
Reference
Ge, Q.S., Zheng, J.-Y., Hao, Z.-X., Shao, X.-M., Wang, W.-C. and Luterbacher, J. 2010. Temperature variation through 2000 years in China: An uncertainty analysis of reconstruction and regional difference. Geophysical Research Letters 37: 10.1029/2009GL041281. The authors write that “knowledge of past climate can improve our understanding of natural climate variability and also help address the question of whether modern climate change is unprecedented in a long-term context,” which is perhaps the most burning scientific question of our day. In addition, they say that “regional proxy temperature series with lengths of 500-2000 years from China have been reconstructed using tree rings with 1-3 year temporal resolution, annually resolved stalagmites, decadally resolved ice-core information, historical documents with temporal resolution of 10-30 years, and lake sediments resolving decadal to century time scales,” noting that “these proxies provide quantitative estimates of past climate through statistical calibration against instrumental temperature measurements.”
Against this backdrop, Ge et al. developed five regional composite temperature reconstructions for China that extended back in time a full two millennia (Northeast, Tibet, Central East), one that extended back approximately 950 years (Northwest), and one that only went back about 550 years (Southeast). With respect to the three sections of China that extended through the Medieval Warm Period and the one that extended into but not through it, the six scientists report that (1) in the Northeast, there was a warm period “between approximately 1100 and 1200 that exceeded the warm level of the last decades of the 20th century,” (2) in Tibet, there was a “warming period of twenty decadal time steps between the 600s and 800s” that was “comparable to the late 20th century,” (3) in the Central East, there were two warm peaks (1080s-1100s and 1230s-1250s) that had “comparable high temperatures to the last decades of the 20th century,” although the graph of their data indicate that these two periods were actually warmer than the last decades of the 20th century, and (4) in the Northwest, “comparable warm conditions in the late 20th century are also found around the decade 1100s.”
Since portions of two of the four sections of China for which temperature reconstructions extended far enough back in time to sample the Medieval Warm Period exhibited temperatures comparable to those of the late 20th century, and since portions of two other sections actually revealed parts of the Medieval Warm Period to have been warmer than the late 20th century, it is clear that there is nothing unusual, unnatural or unprecedented about the country’s current level of warmth. Hence, by the reasoning set forth by Ge et al. in the introduction to their study, there is no compelling reason to attribute late 20th-century warmth in that sprawling country to 20th-century increases in the air’s CO2 concentration, nor to attribute it to concomitant increases in any other greenhouse gases. See post here.
And from this story
World’s Water Towers
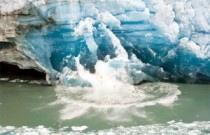
Photo courtesy of: Times of Malta.
Apparently it’s not just the polar icecaps breaking apart that’s cause for worry. Yesterday a huge ice block snapped from a mountain in Peru and plunged into a lake, causing a 75-foot tsunami that washed away dozens of homes and a water processing plant in a rural town. Up to a half dozen people died. So much for slow glacial melt. The Hualcan glacier collapse proves that climate change can be just as dramatic and sudden in the tropics as it is on the poles. This may go down as the first ever inland tsunami. Certainly the mountain villagers weren’t expecting it. The glacier collapse is also a clear sign that the tropical ice fields are in danger. Peru is home to 70 percent of the world’s tropical ice fields, but there is one notable other: Mount Kilimanjaro in Tanzania.
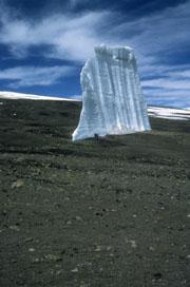
Remnant of Kilimanjaro’s eastern ice field, courtesy of: Lonnie G. Thompson.
A 2009 analysis of Kilimanjaro’s three ice fields ringing the summit by Ohio State University’s Lonnie Thompson showed an 85 percent decline in area covered since 1912, nearly a quarter of it occurring between 2000 and 2007. Their disappearance by 2033 will end an 11,000 year existence on Africa’s highest peak. Fortunately for East Africa, the mountain provides little drinking water, although it does support a thriving tourist industry that may disappear with the ice.
The Andes are different. Tens of millions of people will be left without drinking water as the ice fields dry up. Called the world’s “water towers,” the glaciers in the Peruvian Andes support the largest tropical ice body. They are the source of hydroelectric power generation, crop irrigation, and drinking water supplies. According to a 2009 World Bank study, Equator’s capital, Quito, draws 50 percent of its water supply from the glacial basin, while Bolivia’s La Paz, 30 percent. Lima, Peru would lose a 10-year supply line of water with the loss of glaciers in its country. Without its icy Andes peaks, South America will surely be for the worse.
Further south from Hualcan near the border with Bolivia is Quelccaya, whose ice cap spans 17 miles but has been rapidly retreating. Lonnie Thompson said half of Quelccaya could disappear this year, exacerbated by natural cycles like El Nino, which releases heat in the lower atmosphere.
The Quelccaya Ice Cap is melting

Quelccaya has been studied since 1983, when the first tropical ice cores were taken from its high dome. That has made it a noted case study in climate change. Tropical glaciers like Quelccaya and Kilimanjaro respond strongly to key climatological variables: temperature, precipitation, cloudiness, humidity, and radiation. That’s according to Thompson’s 2007 paper, Abrupt Climate Changes: Past, Present and Future, published in the Journal of Land Resources and Environmental Law. He wrote:
“.. the observation that virtually all tropical regions are retreating under the current climate regime strongly indicates that a large-scale warming of the Earth system is currently underway.”
In the paper, he notes that recovered ice cores from ice fields in Tibet and the Andes reveal (through analysis of oxygen isotopes) that current warming at high elevations along mid to low latitudes (meaning closer to the equator) “is unprecedented for the last two millennia.” Preserved wetland plants are being exposed by Quelccaya’s glacial retreat and have been radiocarbon dated to more than 5,000 years ago, during the early Holocene when temperatures were warmer. To put it bluntly, climate change is creating conditions in the Andes last seen more than 5,000 years ago.
H/T SEPP: Comments SEPP: “To put it bluntly, climate change is creating conditions in the Andes last seen more than 5,000 years ago."It did not dawn on the writer to ask what caused the warming 5,000 years ago - auto exhausts? The IPCC denies that the Holocene Climate Optimum was global. Probably not realizing it, the writer is contradicting the IPCC. Also, recent Chinese studies contradict the 2007 paper cited in the article on glacier melt in Tibet.
By Roger Pielke Sr., Climate Science Weblog
There has been considerable discussion of the 2007 IPCC reports and its errors and exclusion of peer reviewed scientific perspectives that differ from those of the IPCC lead authors (e.g. see Judy Curry’s perceptive discussion of this topic). In 2007, I documented this clear bias in the IPCC reports in two posts (the second one will appear tomorrow). I have reproduced this demonstration of bias below, as it is directly relevant to the current well-justified concerns on the accuracy, balance and value of the 2007 IPCC WG1 report.
The 2007 Intergovernmental Panel on Climate Change (IPCC) Reports have the following stated goals: “A comprehensive and rigourous picture of the global present state of knowledge of climate change” and “The Intergovernmental Panel on Climate Change (IPCC) has been established by WMO and UNEP to assess scientific, technical and socio-economic information relevant for the understanding of climate change, its potential impacts and options for adaptation and mitigation.” However, the IPCC WG 1 Chapter 3 report failed in this goal. This weblog illustrates this defect using the example of their assessment of the multi-decadal land near-surface temperature trend data, where peer reviewed papers that conflicted with the robustness of the surface air temperature trends are ignored. Later Climate Science weblogs will document this issue with other climate issues. Readers of Climate Science are invited to present other important peer reviewed papers that were available to the IPCC that were ignored in their assessment as further evidence to document IPCC bias. To evaluate the IPCC’s claim to be comprehensive, we cross-compared IPCC WG1 references on near-surface air temperature trends with the peer-reviewed citations that have been given in Climate Science. We selected only papers that appeared before about May 2006 so they were readily available to the IPCC Lead authors.
The comparison follows where the bold faced citations are in the IPCC WG1 Report:
I. ISSUES WITH THE ROBUSTNESS OF THE IPCC CONFIDENCE IN THE SURFACE TEMPERATURE RECORD
Chase, T.N., R.A. Pielke Sr., J.A. Knaff, T.G.F. Kittel, and J.L. Eastman, 2000: A comparison of regional trends in 1979-1997 depth-averaged tropospheric temperatures. Int. J. Climatology, 20, 503-518.
Davey, C.A., and R.A. Pielke Sr., 2005: Microclimate exposures of surface-based weather stations – implications for the assessment of long-term temperature trends. Bull. Amer. Meteor. Soc., Vol. 86, No. 4, 497-504.
Davey, C.A., R.A. Pielke Sr., and K.P. Gallo, 2006: Differences between near-surface equivalent temperature and temperature trends for the eastern United States – Equivalent temperature as an alternative measure of heat content. Global and Planetary Change, 54.
de Laat, A.T.J. and A.N. Maurellis, 2006: Evidence for influence of anthropogenic surface processes on lower tropospheric and surface temperature trends. International Journal of Climatology, 26, 897-913.
Gonzalez, J. E., J. C. Luvall, D. Rickman, D. E. Comarazamy, A. J. Pican, E. W. Harmsen, H. Parsiani, N. Ramarez, R. Valzquez, R. Williams, R. B. Waide, and C. A. Tepley, 2005: Urban heat islands developing in coastal tropical cities. Eos Trans. AGU, 86(42), 397.
Hale, R.C., K.P. Gallo, T.W. Owen, and T.R. Loveland, 2006: Land use/land cover change effects on temperature trends at U.S. Climate Normals Stations. Geophys. Res. Lett., 33, doi:10.1029/2006GL026358.
Hanamean, J.R. Jr., R.A. Pielke Sr., C.L. Castro, D.S. Ojima, B.C. Reed, and Z. Gao, 2003: Vegetation impacts on maximum and minimum temperatures in northeast Colorado. Meteorological Applications, 10, 203-215.
Hansen, J., R. Ruedy, J. Glascoe, and M. Sato, 1999: GISS analysis of surface temperature change. J. Geophys. Res. 104, 30997-31022, doi:10.1029/1999JD900835.
Hansen, J.E., R. Ruedy, Mki. Sato, M. Imhoff, W. Lawrence, D. Easterling, T. Peterson, and T. Karl, 2001: A closer look at United States and global surface temperature change. J. Geophys. Res. 106, 23947-23963, doi:10.1029/2001JD000354.
Hansen, J., L. Nazarenko, R. Ruedy, Mki. Sato, J. Willis, A. Del Genio, D. Koch, A. Lacis, K. Lo, S. Menon, T. Novakov, Ju. Perlwitz, G. Russell, G.A. Schmidt, and N. Tausnev, 2005: Earth’s energy imbalance: Confirmation and implications. Science 308, 1431-1435, doi:10.1126/science.1110252.
Hansen, J., Mki. Sato, R. Ruedy, L. Nazarenko, A. Lacis, G.A. Schmidt, G. Russell, I. Aleinov, M. Bauer, S. Bauer, N. Bell, B. Cairns, V. Canuto, M. Chandler, Y. Cheng, A. Del Genio, G. Faluvegi, E. Fleming, A. Friend, T. Hall, C. Jackman, M. Kelley, N. Kiang, D. Koch, J. Lean, J. Lerner, K. Lo, S. Menon, R. Miller, P. Minnis, T. Novakov, V. Oinas, Ja. Perlwitz, Ju. Perlwitz, D. Rind, A. Romanou, D. Shindell, P. Stone, S. Sun, N. Tausnev, D. Thresher, B. Wielicki, T. Wong, M. Yao, and S. Zhang 2005. Efficacy of climate forcings. J. Geophys. Res. 110, D18104, doi:10.1029/2005JD005776.
Hansen, J., M. Sato, R. Ruedy, K. Lo, D.W. Lea, and M. Medina-Elizade, 2006: Global temperature change. PNAS, 103, 14288 - 14293.
He, J. F., J. Y. Liu, D. F. Zhuang, W. Zhang, and M. L. Liu 2007: Assessing the effect of land use/land cover change on the change of urban heat island intensity Theor. Appl. Climatol., DOI 10.1007/s00704-006-0273-1
Holder, C., R. Boyles, A. Syed, D. Niyogi, and S. Raman, 2006: Comparison of Collocated Automated (NCECONet) and Manual (COOP) Climate Observations in North Carolina. J. Atmos. Oceanic Technol., 23, 671-682.
Huang Y., R. E. Dickinson and W. L. Chameides, 2006: Impact of aerosol indirect effect on surface temperature over East Asia. Proc. Natl. Acad. Sci., 103, 4371-4376, doi: 10.1073/pnas.0504428103.
Hubbard, K.G., and X. Lin, 2006: Reexamination of instrument change effects in the U.S. Historical Climatology Network. Geophys. Res. Lett., 33, L15710, doi:10.1029/2006GL027069.
Jones, P.D., and A. Moberg. 2003: Hemispheric and large-scale surface air temperature variations: An extensive revision and an update to 2001. J. Climate 16, 206-223.
Kalnay E., and M. Cai, 2003a: Impact of urbanization and land-use change on climate. Nature, 423, 528-531;
Kalnay, E. and M. Cai, 2003b: Impact of urbanization and land-use change on climate - Corrigenda. Nature, 425, 102.
Kalnay, E., M. Cai, H. Li, and J. Tobin, 2006: Estimation of the impact of land-surface forcings on temperature trends in eastern United States J. Geophys. Res., Vol. 111, No. D6, D06106.
Karl, T.R., S.J. Hassol, C.D. Miller, and W.L. Murray, Eds., 2006: Temperature Trends in the Lower Atmosphere: Steps for Understanding and Reconciling Differences. A Report by the Climate Change Science Program and the Subcommittee on Global Change Research, Washington, DC.
Lim, Y.K., M. Cai, E. Kalnay, and L. Zhou, 2005: Observational evidence of sensitivity of surface climate changes to land types and urbanization. Geophys. Res. Lett., Vol. 32, No. 22, L2271210.1029/2005GL024267.
Mahmood, R., S.A. Foster, and D. Logan, 2006: The GeoProfile metadata, exposure of instruments, and measurement bias in climatic record revisited. Int. J. Climatology, 26(8), 1091-1124.
Parker, D.E., 2004: Large-scale warming is not urban. Nature, 432, 290, doi:10.1038/432290a
Peterson, T.C., 2003: Assessment of urban versus rural in situ surface temperatures in the contiguous United States: No difference found. J. Climate, 16, 2941-2959.
Peterson, T.C., 2006. Examination of potential biases in air temperature caused by poor station locations. Bull. Amer. Meteor. Soc., 87, 1073-1089.
Peterson, T.C. and R.S. Vose, 1997: An overview of the Global Historical Climatology Network temperature data base. Bull. Amer. Meteor. Soc., 78, 2837-2849,
Peterson, T.C., D.R. Easterling, T.R. Karl, P. Ya. Groisman, N. Nicholls, N. Plummer, S. Torok, I. Auer, R. Boehm, D. Gullett, L. Vincent, R. Heino, H. Tuomenvirta, O. Mestre, T. Szentimre, J. Salinger, E. Farland, I. Hanssen-Bauer, H. Alexandersson, P. Jones, D. Parker, 1998: Homogeneity adjustments of in situ atmospheric climate data: A review. Int. J. Climatology, 18, 1493-1517.
Robeson, S.M., 2004: Trends in time-varying percentiles of daily minimum and maximum temperature over North America. Geophys. Res. Letts., 31, L04203, doi:10.1029/2003GL019019.
Runnalls, K.E. and T.R. Oke, 2006: A technique to detect microclimatic inhomogeneities in historical records of screen-level air temperature. J. Climate, 19, 959-978
Schmidt, G.A., R. Ruedy, J.E. Hansen, I. Aleinov, N. Bell, M. Bauer, S. Bauer, B. Cairns, V. Canuto, Y. Cheng, A. Del Genio, G. Faluvegi, A.D. Friend, T.M. Hall, Y. Hu, M. Kelley, N.Y. Kiang, D. Koch, A.A. Lacis, J. Lerner, K.K. Lo, R.L. Miller, L. Nazarenko, V. Oinas, Ja. Perlwitz, Ju. Perlwitz, D. Rind, A. Romanou, G.L. Russell, Mki. Sato, D.T. Shindell, P.H. Stone, S. Sun, N. Tausnev, D. Thresher, and M.-S. Yao, 2006: Present day atmospheric simulations using GISS ModelE: Comparison to in-situ, satellite and reanalysis data. J. Climate, 19, 153-192,
Trenberth, K.E., 2004: Rural land-use change and climate. Nature, 427, 213, doi:10.1038/427213a. doi:10.1175/JCLI3612.1.
Vose, R.S., T.R. Karl, D.R. Easterling, C.N. Williams, and M.J. Menne, 2004: Impact of land-use change on climate. Nature, 427, 213-21
Vose, R., D.R. Easterling, and B. Gleason, 2005: Maximum and minimum temperature trends for the globe: An update through 2004. Geophys. Res. Letts.,. 32, L23822, doi:10.1029/2005GL024379
Vose, R.S., D.R. Easterling, T.R. Karl, and M. Helfert, 2005: Comments on “Microclimate Exposures of Surface-Based Weather Stations” Bull. Amer. Meteor. Soc., 86, 504-506.
Zhou, L., R.E. Dickinson , Y. Tian, J. Fang , Q. Li , R.K. Kaufmann, C.J. Tucker, and R.B. Myneni, 2004: Evidence for a significant urbanization effect on climate in China. PNAS, 101, 9540-9544.
If the papers were neglected because they were redundant, this would be no problem. However, they are ignored specifically because they conflict with the assessment that is presented in the IPCC WG1 Report, and the Lead Authors do not agree with that perspective! That is hardly honoring the IPCC commitment to provide “A comprehensive and rigourous picture of the global present state of knowledge of climate change”. Moreover, the conflict of interest that was identified in the CCSP Report “Temperature Trends in the Lower Atmosphere: Steps for Understanding and Reconciling Differences” is perpetuated in the IPCC WG1 Chapter 3 Report [where the Editor of this CCSP Report, Tom Karl, is also Review Editor for the Chapter 3 of the 2007 IPCC WG1 Report].
These comments were made with respect to this CCSP Report “The process for completing the CCSP Report excluded valid scientific perspectives under the charge of the Committee. The Editor of the Report systematically excluded a range of views on the issue of understanding and reconciling lower atmospheric temperature trends. The Executive Summary of the CCSP Report ignores critical scientific issues and makes unbalanced conclusions concerning our current understanding of temperature trends?.”
“Future assessment Committees need to appoint members with a diversity of views and who do not have a significant conflict of interest with respect to their own work. Such Committees should be chaired by individuals committed to the presentation of a diversity of perspectives and unwilling to engage in strong-arm tactics to enforce a narrow perspective. Any such committee should be charged with summarizing all relevant literature, even if inconvenient, or which presents a view not held by certain members of the Committee.”
The IPCC WG1 Chapter 3 Report process made the same mistakes and failed to provide an objective assessment. Indeed the selection of papers to present in the IPCC (as well as how the work of others that was cited was dismissed) had a clear conflict of interest as the following individuals cited their research prominently yet were also a Review Editor (Tom Karl), works for the Review Editor (Tom Peterson, Russ Vose, David Easterling), were Coordinating Lead Authors (Kevin Trenberth and Phil Jones), were Lead Authors (Dave Easterling and David Parker), or a Contributing Author (Russ Vose).
In fact, as stated above, the CCSP Report “Temperature Trends in the Lower Atmosphere: Steps for Understanding and Reconciling Differences” with its documented bias, was chaired by the same person as the Review Editor of the IPCC WG1 Chapter 3 Report (Tom Karl)! Regardless of his professional expertise, he is still overseeing an assessment which is evaluating his own research. There cannot be a clearer conflict of interest.
The IPCC WG1 Chapter 3 Report clearly cherrypicked information on the robustness of the land near-surface air temperature to bolster their advocacy of a particular perspective on the role of humans within the climate system. As a result, policymakers and the public have been given a false (or at best an incomplete) assessment of the multi-decadal global average near-surface air temperature trends. See part I post here.
By Gene J. Koprowski
A leading global warming skeptic recruited a group of concerned citizens to fact-check the sources referenced in the U.N.’s latest climate-change bible—and gave the report an “F.” Now she’s planning the nail in the coffin: a comprehensive audit of the entire report. Following a series of scandals that led to doubts about the accuracy of the United Nations’ most recent climate-change report, Donna Laframboise of NoConsensus.org gathered a group of citizens online and proved that the U.N. over-relied upon so-called “gray literature,” rather than using exclusively peer-reviewed scientific reports as the organization was supposed to do.
Now Laframboise and her colleagues are taking the next step, FoxNews.com has learned. They are building an online database that will let everyone see exactly what the report claims—and precisely how it came to those conclusions. “There’s a pile of work that can and should be done on this report,” Laframboise told FoxNews.com. The Canadian watchdog is working with a computer programmer in Australia whose software will let her and her colleagues further analyze the report by the Intergovernmental Panel on Climate Change (IPCC), the U.N.’s climate arm.
“It’s starting to look good, and he is linking in all sorts of other material, including IPCC reviewer comments to various parts of the text—at the moment they aren’t easy to access by the average person—as well as the entire Climate-gate e-mail database,” Laframboise said.
“I suspect it’ll be a month, perhaps two, before he’s ready for prime time. At that point, there will be a friendly web-based interface for everyone to use. When he finally goes live, it’s going to be an extremely powerful research tool. So there are good things in the pipeline.”
Contacted repeatedly by FoxNews.com for comment on Lafromboise’s criticism’s and NoConsensus.org’s plans, IPCC spokeswoman Isabel-Garcia Gill refused to comment. The Union of Concerned Scientists was critical of Lafromboise’s initial effort. Chief scientist Peter Frumhoff, a lead author of the deforestation section of the U.N.’s climate-change report, claimed that “by and large, the IPCC process works exceptionally well.” He welcomed an additional review of the IPCC data, saying that “independent review of IPCC procedures will assess opportunities for further strengthening it.”
But another former contributor to the IPCC process, Patrick J. Michaels, a scientist and senior fellow in environmental studies at the Cato Institute, a libertarian think tank, and the past president of the American Association of State Climatologists, told FoxNews.com that the real criticism of the U.N.’s climate report has just begun. In addition to Laframboise’s NoConsensus.org, he said, there is a new “parallel universe” of online publications emerging, manned by serious scientists critical of the approach by governments around the world to climate change. He includes sites such as Climate Audit, Watts Up With That?, and TheBlackboard in that galaxy. “A parallel universe is assembling itself parallel to the IPCC,” Michaels told FoxNews.com. “This universe has become very technical—very proficient at taking apart the U.N.’s findings.”
Michaels is presenting a new report during the upcoming Heartland Institute conference on climate change that examines the EPA finding that carbon dioxide is endangering the planet and needs to be regulated. The finding was released last winter on the eve of the Copenhagen Climate Change Summit. “The endangerment finding was based on the fourth assessment finding by the IPCC and the synthesis report by the U.S. Global Change Research Institute,” said Michaels. He worries that policymakers, who cannot get cap and trade legislation through the U.S. Senate, may try to make regulations based on the U.N.’s global warming report, as incorporated into the “endangerment” finding on CO2. That report, says Michaels, “suffers from systemic errors.”
All of this skepticism is hacking away at public support for global warming regulations. A poll published last week by Rasmussen Reports indicates that only 33 percent of Americans think global warming is caused by human activity; 48 percent think it is caused by longer-term planetary trends.
Getting new data out to the public is the mission of Laframboise, Climate Audit, and the other online publishers. “Many of the volunteers who participated in the citizen audit feel there is more work to be done and have expressed an interest in taking part in future projects,” Laframboise told FoxNews.com. “We’re in a position to assess whether the IPCC followed or broke any other rules. Now that we’ve seen how seriously they took the peer-reviewed rule, we suspect that there are numerous other guidelines, that they themselves established, and boasted about following, that were also violated. A number of promising avenues for further research were suggested by the project we’ve just completed.”
By Matt Cover, Staff Writer
(CNSNews.com) - A new government report says global warming could lead to an increase in both cancer and mental illness worldwide, and it calls for more federally funded research to determine how that might happen.
The report, A Human Health Perspective on Climate Change, was published by the Interagency Working Group on Climate Change and Health - a combination of scientists from the Centers for Disease Control and Prevention, NIH, State Department, National Oceanic and Atmospheric Administration, Department of Agriculture, the EPA, and the Department of Health and Human Services.
The report’s overall thrust is for more federally funded research to investigate the alleged links between global warming and public health, including the potentially negative effects from warming and the potentially negative side-effect of green technologies. While the report touches on, for example, the health effects of unclean water and respiratory ailments, it also deals with two other types of health issues not normally associated with global warming: cancer and mental illness.
Cancer
While the report does not claim that global warming will cause new types of cancer, it says that “higher ambient temperatures” caused by global warming will have an effect on cancer rates, probably pushing them higher. “There are potential impacts on cancer both directly from climate change and indirectly from climate change mitigation strategies,” the report said. This increased risk supposedly comes from increased exposure to toxic chemicals, caused by global warming. The report also said that global warming would cause heavy rainfall, which would wash these toxic chemicals into the water. Hotter temperatures may also make these toxic chemicals even more toxic.
“One possible direct impact of climate change on cancer may be through increases in exposure to toxic chemicals that are known or suspected to cause cancer following heavy rainfall and by increased volatilization of chemicals under conditions of increased temperature,” states the report. Another way that global warming will cause more cancer, the report said, was from increased exposure to ultraviolet (UV) radiation, which is known to cause some types of skin cancer. While UV exposure happens every time you go out into the sun, the report said that global warming will make it worse, leading to potentially more skin cancer. “Another direct effect of climate change, depletion of stratospheric ozone, will result in increased ultraviolet (UV) radiation exposure. UV radiation exposure increases the risk of skin cancers and cataracts,” the report stated.
The report also highlighted a surprising way that global warming may cause more cancer: the development of green technologies. Green technologies often involve exotic metals and alloys that, according to the report, may cause cancer. “Increased use of NiMH [nickel-metal-hydride] batteries [used in hybrid and electric cars] will necessarily require significant increases in nickel production and the impacts associated with nickel mining and refining,” states the report. “High-level nickel exposure is associated with increased cancer risk, respiratory disease, and birth defects; the same is true with certain other metals, especially cadmium and lead [used in solar cells and batteries]. Increased production of solar cells also can lead to increased environmental risks,” reads the report. “For example, cadmium-tellurium (CdTe) compounds in photovoltaic systems and the potential for increased cadmium emissions from mining, refining, and the manufacture, utilization, and disposal of photovoltaic modules. Cadmium and cadmium compounds like CdTe are classified as known human carcinogens.”
Mental Health
Another effect of global warming, the report said, was increased mental illness caused by natural disasters. These disasters, which already occur but will be more catastrophic as the world warms, cause stress and anxiety, which can lead to mental illness. “A variety of psychological impacts can be associated with extreme weather and other climate related events,” reads the interagency report. The people most likely to be affected by global warming-caused mental illness are those already susceptible to mental illness, especially stress-induced mental illness. The report states: “Extreme weather events such as hurricanes, wildfires, and flooding, can create increased anxiety and emotional stress about the future, as well as create added stress to vulnerable communities already experiencing social, economic, and environmental disruption. Individuals already vulnerable to mental health disease and stress-related disorders are likely to be at increased risk of exacerbated effects following extreme weather or other climate change events.”
“The most common mental health conditions associated with extreme events range from acute traumatic stress to more chronic stress-related conditions such as post-traumatic stress disorder, complicated grief, depression, anxiety disorders, somatic complaints, poor concentration, sleep difficulties, sexual dysfunction, social avoidance, irritability, and drug or alcohol abuse,” reads the report. As with global warming-caused cancer, the report admits that much more scientific work is needed on the links between global warming and mental illness, saying “numerous research gaps exist.”
“More work is necessary to understand the effects of climate change and extreme weather events on mental health status, to determine how to mitigate these effects, and to overcome the barriers to utilization and delivery of mental health services following extreme weather events,” says the interagency report. Despite the admissions that more research was needed, the report concluded that there was “abundant evidence” of man-caused global warming, saying that “climate change will have” direct impacts on public health.
“There is abundant evidence that human activities are altering the earth’s climate and that climate change will have significant health impacts both domestically and globally.” The report then called for an “overarching” international research effort to determine how all of the “abundant evidence” of global warming would lead to poorer public health. “To be successful, an overarching research program needs to be integrated, focused, interdisciplinary, supported, and sustainable, yet flexible enough to adjust to new information and broad enough to cover the very diverse components described in this document,” states the report. “The effort must also be multinational, multiagency, and multidisciplinary, bringing together the strengths of all partners.”
The other public health effects of global warming cited in the report include: asthma and other respiratory diseases, cardiovascular disease, heat-related deaths, human developmental effects, neurological diseases, waterborne diseases, weather-related deaths, and infectious and animal-borne diseases. See more here.
By Dr. Roy Spencer
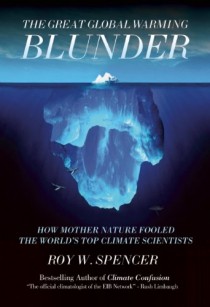
April 20 was the official release date of my new book entitled: “The Great Global Warming Blunder: How Mother Nature Fooled the World’s Top Climate Scientists”, published by Encounter Books. About one-half of Blunder is a non-technical description of our new peer reviewed and soon-to-be-published research which supports the opinion that a majority of Americans already hold: that warming in recent decades is mostly due to a natural cycle in the climate system - not to an increase in atmospheric carbon dioxide from fossil fuel burning.
Believe it or not, this potential natural explanation for recent warming has never been seriously researched by climate scientists. The main reason they have ignored this possibility is that they cannot think of what might have caused it. You see, climate researchers are rather myopic. They think that the only way for global-average temperatures to change is for the climate system to be forced ‘externally’...by a change in the output of the sun, or by a large volcanic eruption. These are events which occur external to the normal, internal operation of the climate system. But what they have ignored is the potential for the climate system to cause its own climate change. Climate change is simply what the system does, owing to its complex, dynamic, chaotic internal behavior.
As I travel around the country, I find that the public instinctively understands the possibility that there are natural climate cycles. Unfortunately, it is the climate “experts” who have difficulty grasping the concept. This is why I am taking my case to the public in this book. The climate research community long ago took the wrong fork in the road, and I am afraid that it might be too late for them to turn back.
NATURE’S SUNSHADE: CLOUDS
The most obvious way for warming to be caused naturally is for small, natural fluctuations in the circulation patterns of the atmosphere and ocean to result in a 1% or 2% decrease in global cloud cover. Clouds are the Earth’s sunshade, and if cloud cover changes for any reason, you have global warming - or global cooling.
How could the experts have missed such a simple explanation? Because they have convinced themselves that only a temperature change can cause a cloud cover change, and not the other way around. The issue is one of causation. They have not accounted for cloud changes causing temperature changes. The experts have simply mixed up cause and effect when observing how clouds and temperature vary. The book reveals a simple way to determine the direction of causation from satellite observations of global average temperature and cloud variations. And that new tool should fundamentally change how we view the climate system.
Blunder also addresses a second major mistake that results from ignoring the effect of natural cloud variations on temperature: it results in the illusion that the climate system is very sensitive. The experts claim that, since our climate system is very sensitive, then our carbon dioxide emissions are all that is needed to explain global warming. There is no need to look for alternative explanations.
But I show that the experts have merely reasoned themselves in a circle on this subject. When properly interpreted, our satellite observations actually reveal that the system is quite IN-sensitive. And an insensitive climate system means that nature does not really care whether you travel by jet, or how many hamburgers or steaks you eat.
CARBON DIOXIDE: FRIEND OR FOE?
The supposed explanation that global warming is due to increasing atmospheric carbon dioxide from our burning of fossil fuels turns out to be based upon little more than circumstantial evidence. It is partly a symptom of our rather primitive understanding of how the climate system works. And I predict that the proposed cure for global warming - reducing greenhouse gas emissions - will someday seem as outdated as using leeches to cure human illnesses.
Nevertheless, despite the fact that scientific knowledge is continually changing, it is increasingly apparent that the politicians are not going to let little things like facts get in their way. For instance, a new draft climate change report was released by the U.S. yesterday (April 19) which, in part, says: “Global warming is unequivocal and primarily human-induced...Global temperature has increased over the past 50 years. This observed increase is due primarily to human-induced emissions of heat-trapping gases.” You see, the legislative train left the station many years ago, and no amount of new science will slow it down as it accelerates toward its final destination: forcibly reducing greenhouse gas emissions.
But in Blunder I address what other scientists should have the courage to admit: that maybe putting more CO2 in the atmosphere is a good thing. Given that it is necessary for life on Earth, the amount of CO2 in the atmosphere is surprisingly small. We already know that nature is gobbling up 50% of what humanity produces, no matter how fast we produce it. So, it is only logical to address the possibility that nature - that life on Earth - has actually been starved for carbon dioxide. This should give you some idea of the major themes of my new book. I am under no illusion that the book will settle the scientific debate over global warming.
To the contrary - I am hoping the debate will finally begin. Buy it here.
-----------------------
Kerry Emamuel responds in WSJ
Data Still Support Climate Change
“Climate Science In Denial” (op-ed, April 22), Richard Lindzen’s attempt to catapult a series of minor errors into a sweeping condemnation of climate science, represents an irresponsible and misleading attempt to substitute polemic for reason. While ignoring the vast body of evidence of ongoing climate change, from increasing sea level to retreating glaciers, from basic theory to advanced climate models, Mr. Lindzen clings to his agenda of denial, advancing spurious hypotheses that have been thoroughly refuted in the peer-reviewed literature, even by climate scientists otherwise inclined toward a conservative view of the issue.
No climate scientist denies that the present state of the science entails large uncertainties in climate projections, with possible outcomes ranging from benign to catastrophic. While science works to reduce these uncertainties, citizens must decide whether and how much resource should be devoted to mitigating the uncertainly estimated risk.
Prof. Kerry Emanuel, Mass. Institute of Technology
By Russell Berman and Ben Geman
A trio of key senators on Thursday pressured Democratic leaders not to let immigration reform displace a global warming bill. Moving the immigration bill first, as House and Senate leaders have discussed, threatens the rare chance of winning passage of climate change legislation, said Sen. Lindsey Graham (R-S.C.). “It destroys the ability to do something like energy and climate,” Graham told reporters in the Capitol. He called the suggestion to move on immigration first “the ultimate CYA politics” - as in “cover your a-.”
Graham and his partners in writing climate legislation, Sens. John Kerry (D-Mass.) and Joe Lieberman (I-Conn.) met with Majority Leader Harry Reid (D-Nev.) on Thursday to discuss their bill and the Senate agenda. Kerry and Lieberman separately told reporters that Reid was committed to bringing their legislatio to the floor, but they did not appear to have received a firm commitment on timing.
Asked if he’s requested that Reid bring up a climate bill before immigration, Kerry said: “I asked the majority leader to do what he thinks is best, but he told us that he would [bring up climate change first].” Pressed further, Kerry said Reid should be asked about the order of the agenda. A spokesman for Reid had no comment on the timing, but said the senators had had a productive meeting. A climate change bill had been seen as holding the pole position in the Senate until this week, when momentum appeared to swing to immigration reform. With the Senate also having to take up the confirmation of a Supreme Court nominee, there’s little chance of covering all the issues before the August recess, when Congress will turn almost all of its attention to the midterm elections.
-------------------
Global Warming and Profiteering in the Obama Administration
Chris Horner, senior fellow at the Competitive Enterprise Institute, tells PJTV Washington Bureau Chief Richard Pollock why new documents reveal how one well-placed green activist in the Obama administration faces severe conflicts of interest. Plus, why Horner’s new book blows the lid off Obama’s environmental policy.
CLICK HERE
Dr. Vincent Gray, NZ Climate Truth Newsletter
All of the computer models of the climate have adopted the flat earth theory of the earth’s energy, as portrayed in Kiehl J. T. and K. E. Trenberth 1997. Earth’s Annual Global Mean Energy Budget. Bull. Am. Met. Soc. 78 197-208.
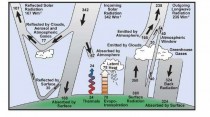
The attached (enlarged) graph is in all of the Reports of the Intergovernmental Panel on Climate change, and it is fundamental to all their activities.
It assumes that the earth can be considered to be flat, that the sun shines all day and all night with equal intensity, and that the temperature of the earth’s surface is constant.
All the quantities on the graph are given as correct to the nearer Watt per square meter, but the figures in the paper are shown to possess very high inaccuracy which can never be measured, but always has to be “qualitatively estimated”. On this occasion it was possible to stretch these inaccuracies to the level needed to provide a “balanced” energy budget. The total energy entering is made equal to the energy leaving. In this way it is now possible to calculate the effect of additional greenhouse gases. If it was not “balanced” and the “balance” varied it would be impossible to calculate.what are the effects of additional greenhouse gases.
There has now been a change of heart, in the following paper: Trenberth, K E, J T Fassulo, and J T Kiehl. 2009 Earth’s Global Energy Budget. Bull Am. Met. Soc. 90 311-323. This paper does a complete reassessment of the figures in the first paper. Its amended version as a mean between March 2000 and May 2004 is attached (enlarged).
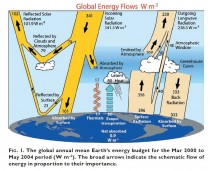
The earth is now thoroughly flattened, as if it had been run over by a cosmic steamroller. Most of the figures have changed. Those for input and output of radiation
are now apparently correct to one place of decimals. The rest of them are in trouble. The paper is full of discussions on how they could increase the “qualitative estimates” of uncertainty that might be attached to them, but this time they have found it impossible to extend their estimating ability sufficiently. So this time it is “unbalanced” to the extent of a warming of 0.9 Watts per square meter a year for the period 2000 to 2004.
Unfortunately there is no doubt that the earth’s temperature cooled over this period. This paper is therefore firm proof that the original concepts behind the models are wrong. It ought to be obvious. The earth does actually rotate. The sun does not shine at night. The temperature is not constant. Every part of the earth has a different energy input from its output.
There is a correct mathematical treatment. It would involve the division of the earth’s surface into a large number of tiny increments, and the energy input and output calculated for each one, using the changes in all the factors involved. There would then have to be a gigantic integration of all these results to give a complete energy budget for the earth. Only when this is done and repeated over a long period will it be possible to find the influence of increases in greenhouse gases.
The data do not exist for such an exercise and probably never will. Until then we will have to settle for the methods that have been developed by meteorologists over the past two centuries and hope that these can be extended over time to provide us with a means for assessing the effects of additional greenhouse gases on the climate.
The currently promoted greenhouse theory is dead and its consequences have to be removed at once.
Comments by Dr. Richard Keen on the changed budget numbers and the “missing heat”:
Here’s the budget chart showing the changes from Kiehl and Trenberth 1997 to Trenberth et al. 2009. There are many ways to interpret these changes, one possiblity being that they show actual changes between the two base periods. Or, they may indicate the uncertainties inherent in each estimated value. Choosing the latter interpretation, one can see that each component of the budget has changed by up to 11 W/m2 (absolute value), with a mean change of 5 W/m2 (below, enlarged here).
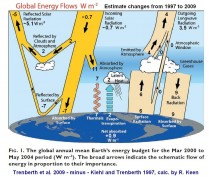
There are 15 “independent” values listed (some are listed twice), although I’m sure the determinations are not truly independent of each other. If one takes the “Net Absorbed” value at the surface as being the residual sum (or average) of these 15 values, then the uncertainty of this residual would be the standard error of the mean, or roughly the mean error of each of the 15 values divided by the square root of N (15). That gives an uncertaintly of 1.3 W/m2 for the value of 0.9 W/m2 for the “Net Absorbed”. Thus, using Trenberth et al.’s statistics, the “Net Absorbed” could be a “Net Emitted”, and the value is indistinguishable from zero. Perhaps that is where the “Missing Energy” is.
Vincent Gray responds back: For the 2009 amended curve they kid themselves that they have better measurements for all the parameters, and that they have been unable to “stretch” their “informed” estimates of the uncertainties sufficiently to get a “balance”. and they get a warming. In reality there would still be a complex distribution curve with warming and cooling almost equally possible. The reality of this complex diffuse distribution curve could never be admitted because it means that the models are meaningless. Trenberth has almost got round to this point when he admits in his ClimateGate Email, that it is a “travesty” (ICECAP NOTE: Kevin Trenberth says they can’t account for the lack of recent warming and that it is a travesty that they can’t.(1255352257) and Kevin Trenberth says climatologists are nowhere near knowing where the energy goes or what the effect of clouds is. Says nowhere balancing the energy budget. Geoengineering is not possible.(1255523796)).


